POPULATION AND MIGRATION
OF THE NETHERLANDS
POPULATION 17,016,967
|
RATE OF NATURAL INCREASE 2.19/1,000 POPULATION (IN 2015)
|
POPULATION AGE <15 % 16.56% (MALE 1,442,0059/FEMALE 1.375.479)
POPULATION AGES 65+ % 18.35% (MALE 1,411,830/FEMALE 1,711,053)
DEPENDENCY RATE 53.3%
LIFE EXPECTANCY AT BIRTH 81.3 YEARS
LIFE EXPECTANCY AT BIRTH FEMALES 83.6 YEARS
LIFE EXPECTANCY AT BIRTH MALES 79.2 YEARS
PRIMARY SCHOOL COMPLETION RATE FEMALES 100 %
PRIMARY SCHOOL COMPLETION RATE MALES 100 %
Secondary School Enrollment Net Females 91 %
Secondary School Enrollment Net Males 90 %
GNI PPP per capita in US$ 48,400
Economically Active Females 15+ 60 %
Economically Active Males 15+ 73 %
Mobile Phone Subscribers (# per 100) 124
Motor Vehicles (# per 1000) 528
Undernourished Population 5 %
Underweight Children Under Age 5 1.6 % in 1980
HIV/AIDS Among People Ages 15-49 0.2 %
|
|
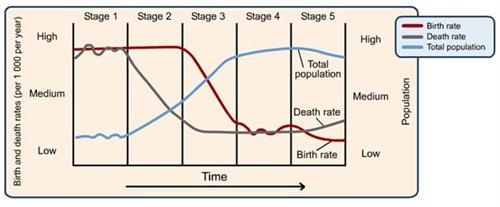
Stage 4The Netherlands is in stage 4 of the demographic transition model. The birth rate and death rate are fairly low. The rate of natural increase is also low. The life expectancy is high. And the fertility rate is pretty average. Most of the countries in Europe are at stage 4 of this model and this is one of them.
|
|
The two topics I chose for my gapminder active chart for Netherlands are, GNI/Capita PPP, $ and Males aged 15+ employed%. GNI/Capita PPP, $ is on the y-axis and Males aged 15+ employed% is on the x-axis. I chose these two topic because Netherlands has the highest GNI/Capita PPP, $ of all my countries so I wanted to see . I thought It would be interesting to see this country compared to other undeveloped and developed countries.
