POPULATION AND MIGRATION
OF HAITI
POPULATION 10,485,800
|
RATE OF NATURAL INCREASE 16.6/1,000 POPULATION (IN 2015)
|
POPULATION AGE <15 % 33.39 % (MALE 1744,599/FEMALE 1,756,155)
POPULATION AGES 65+ % 4.09 % (MALE 189,098/FEMALE 239,674)
DEPENDENCY RATE 62.3 %
LIFE EXPECTANCY AT BIRTH 63.8 YEARS
LIFE EXPECTANCY AT BIRTH FEMALES 66.4 YEARS
LIFE EXPECTANCY AT BIRTH MALES 61.2 YEARS
PRIMARY SCHOOL COMPLETION RATE FEMALES 35 % (1987)
PRIMARY SCHOOL COMPLETION RATE MALES 30 % (1987)
SECONDARY SCHOOL ENROLLMENT NET FEMALES 15 %
SECONDARY SCHOOL ENROLLMENT NET MALES 10 %
GNI PPP PER CAPITA IN US$ 1,760
ECONOMICALLY ACTIVE FEMALES 15+ 58 %
ECONOMICALLY ACTIVE MALES 15+ 83 %
MOBILE PHONE SUBSCRIBERS (# PER 100) 70/100
MOTOR VEHICLES (# PER 1000) 12
UNDERNOURISHED POPULATION 53 %
UNDERWEIGHT CHILDREN UNDER AGE 5 11.60 %
HIV/AIDS AMONG PEOPLE AGES 15-49 1.7 %
|
|
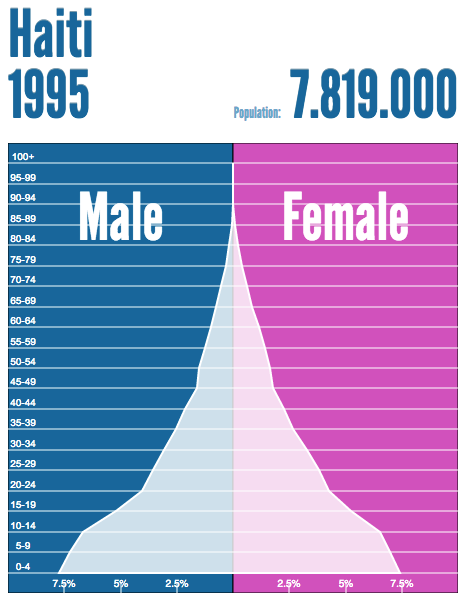
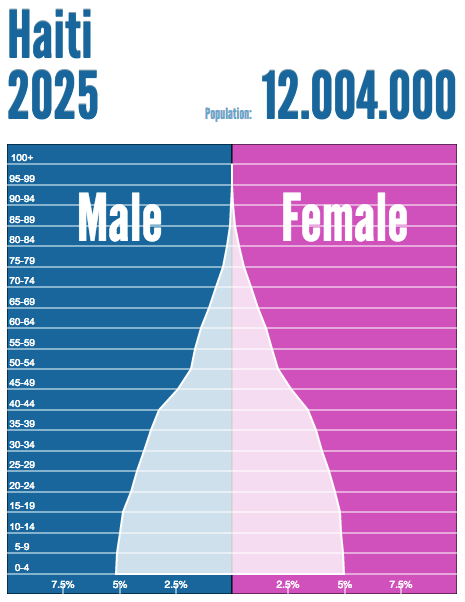
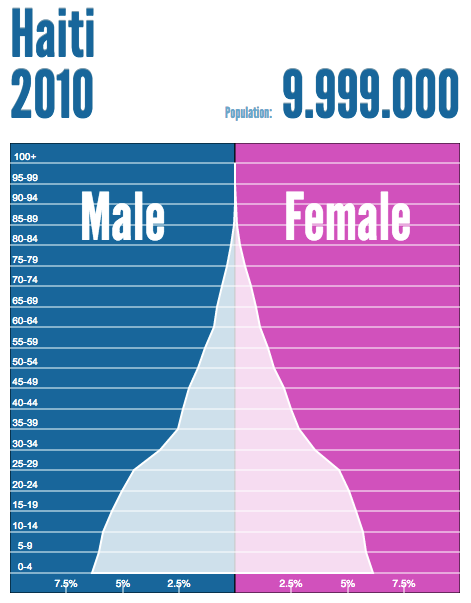
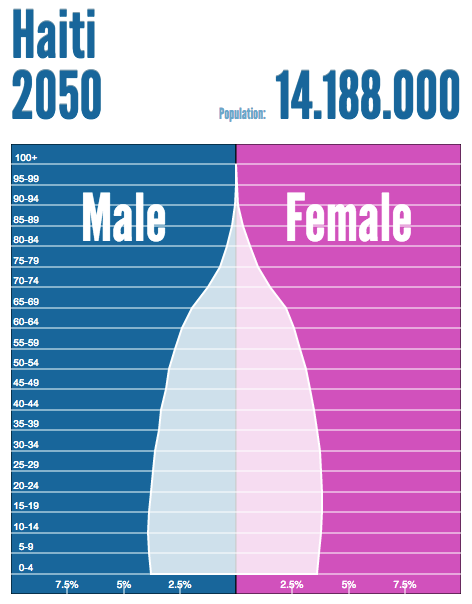
Stage 3Haiti is at the beginning of the third stage. The population grew a lot after 1900, but the life expectancy is very low. The death rate and birth rates are higher than the regional average. Haiti has a young age structure since about two-fifths of the population is younger than 15 years. It also has widespread poverty, low educational attainment and low urbanization, all of these factors have delayed the economic growth.
|

|
The two topics I chose for my gapminder active chart for Haiti are, Life Expectancy and Child Mortality rate. Life expectancy is on the y-axis, and I chose this topic because Haiti has a low expectancy rate due to disease, and many other problems. I thought It would be interesting to see this country compared to other undeveloped and developed countries. Child Mortality rate is on the x-axis, and I chose this topic because since the the life expectancy was so low I wanted to see how the child mortality rate would compare.
